Smart Platforms and Real-Time Data: How Technology Is Transforming Sports Engagement

The Stadium in Your Pocket
Ten years ago, watching a football match meant sitting in front of a television and waiting for the commentator to tell you what just happened. Maybe a graphic would pop up showing possession stats at halftime. That was the extent of data available to ordinary fans.
Now open any sports app during a live match. Player heat maps update every thirty seconds. Expected goals calculations appear before the ball hits the net. Sprint speeds, pass completion rates, pressing intensity – all accessible on a phone screen while the game is still being played. The amount of information available to a fan in 2025 would have been classified as professional scouting material in 2010.
This shift did not happen gradually. It arrived in waves, each technology building on the last, until the cumulative effect became impossible to ignore. Fans today consume sports differently from any previous generation. They watch, yes. But they also track, analyse, compare, predict, and participate in ways that blur the line between spectator and analyst.
What Changed and When
The transformation had distinct phases. Understanding them helps explain why sports engagement looks the way it does now.
| Period | Primary Technology | Fan Behaviour Shift |
| 2008–2012 | Smartphones and basic apps | Checking scores on the go became normal |
| 2012–2016 | Social media integration | Real-time reaction and commentary from fans |
| 2016–2020 | Streaming platforms | Watching anywhere, cord-cutting accelerated |
| 2020–2025 | Data APIs and smart platforms | Fans access professional-grade statistics live |
Each phase changed expectations. Once fans could check scores instantly, waiting for the evening news felt absurd. Once social media provided real-time commentary from millions, listening to two pundits in a studio felt limited. Once streaming allowed watching anywhere, being tied to a living room television felt restrictive.
The current phase – data saturation – follows the same pattern. Fans who grew accustomed to live expected goals and player tracking will not return to watching without that layer. The information became part of the experience itself.
Second-Screen Behaviour
Most people watching live sports now do so with a phone in hand. Not to ignore the game – to enhance it. Research from Global Web Index shows that 74% of sports viewers use a second device during live broadcasts. They are checking stats, reading commentary, messaging friends, or engaging with platforms that add interactive elements to viewing.
This behaviour frustrated broadcasters initially. They saw phones as competition for attention. Smarter ones recognised the opportunity. If viewers are going to look at screens anyway, give them a reason to look at your screen.
Second-screen engagement typically includes several activities happening simultaneously:
- Checking live statistics that television coverage does not show.
- Participating in polls or predictions related to the current match.
- Reading and posting commentary on social platforms.
- Engaging with winbet bd and similar platforms for live predictions.
- Messaging friends who are watching the same event elsewhere.
- Looking up player history or head-to-head records mid-match.
The phone is no longer a distraction from the sports experience. For millions of fans, it is the sports experience – or at least an inseparable part of it.

The Data Layer
Professional sports teams have used performance data for decades. What changed is accessibility. The same tracking systems that help coaches make tactical decisions now feed consumer-facing applications. A fan can see the same sprint distance data that the manager sees, often within minutes of it being recorded.
Comparison of data accessibility between professional and consumer levels:
| Data Type | Professional Access (2015) | Consumer Access (2015) | Consumer Access (2025) |
| Player positioning | Real-time | None | Live with a 30-second delay |
| Sprint speeds | Real-time | Post-match summary | Live |
| Pass networks | Real-time | Never | Live visualisation |
| Expected goals | Real-time | Rare, post-match | Live, multiple models |
| Physical load metrics | Real-time | Never | Partial, next-day |
| Tactical formations | Real-time | Commentator guesses | Live automated detection |
This democratisation of data created a new type of fan. Not content to simply watch, they want to understand. Forums and social media are filled with tactical analysis that would have seemed impossibly detailed twenty years ago. Podcasts break down matches using metrics that did not exist for public consumption a decade ago.
The knowledge gap between professionals and engaged amateurs shrank considerably. Companies specializing in sports analytics now provide insights that were previously available only to professional teams – a democratization of data that leveled the playing field. A dedicated fan with good data literacy can now conduct analysis that rivals what full-time analysts produced in the early 2000s.
Live Engagement Platforms
Static viewing gave way to interactive participation. Platforms emerged that transform watching sports from passive reception into active involvement. Prediction games, fantasy contests, live betting, social viewing parties – all designed to give fans stakes in the outcome beyond simple emotional investment.
Prediction and Gaming
The simplest form: guess what happens next. Will there be a goal in the next ten minutes? Which team gets the next corner? Who scores first? These micro-predictions turn ninety minutes of football into dozens of individual moments, each carrying its own tension.
Platforms refined this into sophisticated products. Live odds shift with game state. A team going down to ten men immediately changes every subsequent prediction. The rain starting to fall affects expectations for total goals. The systems process information faster than humans can, adjusting in real time.
Fantasy Integration
Season-long fantasy leagues were the first wave. Daily and weekly contests followed. Now real-time fantasy exists – pick your lineup minutes before kickoff, earn points as the match unfolds, and compete against others watching the same game.
This created a strange phenomenon: fans cheering for individual performances over team results. A neutral viewer with a fantasy stake in a particular midfielder cares intensely about that player’s statistics regardless of the match outcome. The emotional investment exists, but it attaches to different targets than traditional fandom.
Social Viewing
Watch parties went digital. Platforms allow synchronised viewing with friends across different locations. Chat functions, reaction sharing, group predictions – all attempting to recreate the social experience of watching together while physically apart.
The pandemic accelerated this dramatically. People who had never considered virtual watch parties suddenly had no alternative. Many continued the behaviour even after restrictions lifted, finding value in expanded social circles that geography had previously prevented.
Mobile-First Design
Sports engagement shifted to mobile faster than most industries. The reasons are obvious: sports happen at specific times that do not respect personal schedules. Being able to follow a match during a commute, at work, or in a waiting room matters enormously. Desktop viewing implies flexibility that live sports do not allow.
Mobile engagement patterns show distinct characteristics:
| Behaviour | Mobile | Desktop | Television |
| Session length | Short, frequent | Longer, focused | Full match |
| Primary activity | Score checking, highlights | Analysis, research | Live viewing |
| Social sharing | Immediate, reactive | Considered, longer form | Rarely during a match |
| Betting activity | High during matches | Pre-match research | Lower |
| Attention level | Partial, interrupted | Moderate | Full or background |
Smart platforms designed for mobile prioritise speed and clarity. Users glance at phones for seconds at a time. Information must be registered immediately. This shaped interfaces – large numbers, colour coding, minimal text, instant updates.
The best mobile sports products do not try to replicate television. They complement it. The phone shows what the broadcast cannot: statistical context, alternative angles, crowd sentiment, and betting line movements.
The Data Supply Chain
Behind every statistic on a fan’s screen sits an elaborate infrastructure. Cameras track player movements. Algorithms identify events. APIs distribute information. Apps display it. The chain from pitch to pocket takes seconds.
Tracking Technology
Modern stadiums bristle with cameras – not just for broadcast, but for data collection. Computer vision systems identify every player, track their position multiple times per second, and log events as they happen. A pass, a tackle, a shot – each becomes a data point almost instantly.
Wearable technology adds another layer. GPS vests worn under jerseys measure acceleration, deceleration, distance covered, and physical load. This data belongs to teams primarily, but aggregated versions increasingly reach consumers.
Processing and Distribution
Raw tracking data means nothing to viewers. Processing transforms coordinates and timestamps into meaningful statistics. Did that sequence of passes constitute a chance? How likely was that shot to result in a goal, given its location and the positions of defenders?
Statistical models answer these questions in real time. Different providers offer different models, creating a market where accuracy and speed compete. Fans develop preferences for particular expected goals calculations, the way they once developed preferences for commentators.
Consumer Applications
The final step: putting processed data in front of fans. Apps compete on speed, accuracy, depth, and interface. Some target casual fans who want quick scores and basic stats. Others serve dedicated analysts who want granular event data and custom visualisation tools.
This fragmented market means fans choose their own depth of engagement. A user can check a match score in three seconds or spend ninety minutes toggling between live heat maps, pass networks, and momentum graphs.
Betting Integration
Sports betting transformed from an occasional activity to a continuous engagement layer. Live betting particularly changed viewing patterns. Every moment of a match becomes an opportunity for prediction and participation.
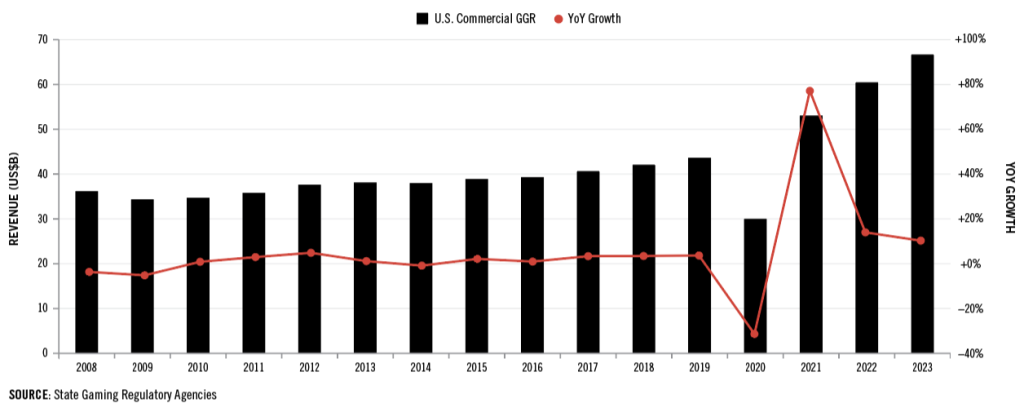
The numbers tell the story. According to the American Gaming Association, legal sports betting in the United States generated $11.04 billion in revenue in 2023 on a total handle of $121 billion – a 46% increase over the previous year. Live betting continues gaining ground: by late 2025, in-play wagers accounted for nearly 50% of US handle, up from 35–40% a year earlier.
How Live Betting Works
Pre-match betting closes when the whistle blows. Live betting continues throughout. Odds adjust constantly based on the match state. A goal changes everything. A red card changes everything. Even shifts in momentum without concrete events affect the lines.
This requires sophisticated technology. Odds must update faster than bettors can exploit discrepancies. Trading teams at bookmakers watch matches with one eye and monitor with the other, adjusting prices in real time while algorithms handle the bulk of recalculation.
Impact on Viewing
Fans who bet live report watching differently. Attention heightens during certain match states. A bet on the next goal scorer creates investment in every attacking play. A bet on total corners turns a routine restart into a moment of significance.
Critics argue that this fragments attention and corrupts the viewing experience. Proponents counter that it intensifies engagement and makes otherwise dull matches interesting. The debate continues, but the behaviour grows regardless.
Platform Economics
Smart sports platforms operate in a competitive attention economy. Users have limited time and many options. Platforms that capture engagement during live sports access a uniquely valuable moment – fans are attentive, emotional, and willing to interact.
Revenue models across sports engagement platforms:
| Platform Type | Primary Revenue | Secondary Revenue | User Value Proposition |
| Streaming services | Subscriptions | Advertising | Access to live content |
| Data providers | B2B licensing | Consumer subscriptions | Statistical depth |
| Betting platforms | Margin on bets | Advertising, data sales | Prediction engagement |
| Fantasy platforms | Entry fees | Advertising, subscriptions | Competition and stakes |
| Social platforms | Advertising | Data licensing | Community and discussion |
The most successful platforms combine multiple models. A streaming service adds statistics. A betting platform adds community features. A fantasy app adds news and analysis. Convergence blurs category boundaries.
Regional Variations
Technology adoption varies by market. Infrastructure, regulation, cultural factors, and economic conditions all influence how fans engage with smart platforms.
South Asian markets show particularly high mobile engagement. Smartphone penetration combined with limited fixed broadband means sports consumption happens primarily on phones. Platforms targeting Bangladesh, India, and Pakistan design mobile-first by necessity.
Cricket dominates these markets, creating specific product requirements. Match formats vary from three hours to five days. Data presentation must adapt. A T20 match rewards rapid updates. A Test match requires different pacing entirely.
Bangladesh Specifically
Cricket remains the primary sport, but football interest grows steadily – particularly in the Premier League and European competitions. Mobile data costs dropped significantly over the past five years, enabling video consumption that was previously impractical.
Platforms serving this market emphasise:
- Low data consumption modes for users on limited plans.
- Bengali language support alongside English.
- Cricket-first design with football as a strong secondary.
- Payment integration with local mobile money systems.
- Content optimised for lower-end smartphone hardware.
The combination of high engagement and growing connectivity makes Bangladesh attractive for platform expansion despite lower average revenue per user compared to Western markets.
Privacy and Data Concerns
All this technology creates uncomfortable questions. Player tracking generates enormous personal data. Who owns it? How can it be used? When athletes become walking data generators, traditional concepts of privacy strain.
Fan data raises different concerns. Engagement platforms know viewing habits, betting patterns, social connections, and location history. This information has commercial value. Users trade privacy for service, often without fully understanding the exchange.
Regulatory responses lag technology. GDPR in Europe created frameworks for data protection, but sports-specific applications remain ambiguous. Other regions have weaker protections. The industry largely self-regulates, with predictable results.
Where This Goes
Prediction is foolish, but trajectories seem clear. Data accessibility will increase. Latency will decrease. Integration between platforms will deepen. The gap between professional and consumer tools will continue shrinking.
Augmented reality applications loom on the horizon. Glasses that overlay statistics on live viewing – whether in stadium or at home – move from prototype to product. When that happens, second-screen behaviour becomes no-screen behaviour. The data lives in the same visual field as the action itself.
Artificial intelligence will generate personalised insights. Rather than showing everyone the same statistics, platforms will learn individual preferences and highlight what each user finds most interesting. The fan obsessed with defensive metrics sees different data than one focused on attacking patterns.
The sports experience will keep fragmenting into individual experiences. Two people watching the same match will see it through entirely different data lenses, each tailored to their particular interests. Whether this enriches or diminishes the communal aspect of sports remains unclear.
For now, the transformation continues. Every season brings new platforms, new data sources, and new ways to engage. Fans adapt quickly, raising expectations higher, demanding more from the technology that frames their viewing. The stadium in your pocket keeps expanding.

Basanti Brahmbhatt
Basanti Brahmbhatt is the founder of Shayaristan.net, a platform dedicated to fresh and heartfelt Hindi Shayari. With a passion for poetry and creativity, I curates soulful verses paired with beautiful images to inspire readers. Connect with me for the latest Shayari and poetic expressions.